In my last blog post, I assembled some temperature/humidity sensors using ESP32 chips and BME280 sensors. Once those were up and running, the next step was to actually get data from them. My goal was to grab the data from those sensors and put it into my Elastic stack, the sink for all logs I care about. In this blog post, I’ll share how I did that using Home Assistant and Python.
Home Assistant Explained
What is Home Assistant? In short, it’s a home automation tool meant to make it easy to connect various devices and create actions based on triggers and rules you create. While automation is the focus, I decided to use it not with automation in mind, but for pure data collection. There were two main reasons I went with Home Assistant: first, it works very well with ESPHome, and second, it has an API so I can extract data from it easily and ship it elsewhere.
To get Home Assistant up and running you have a ton of options. Long-term, I may switch to a VM or dedicated hardware like a NUC, but to get started quickly I went the Docker container route. This command is all you need:
docker run -d \
  --name homeassistant \
  --privileged \
  --restart=unless-stopped \
  -e TZ=MY_TIME_ZONE \
  -v /PATH_TO_YOUR_CONFIG:/config \
  -v /run/dbus:/run/dbus:ro \
  --network=host \
  ghcr.io/home-assistant/home-assistant:stable
Pro-tip: make sure the path to your config is a real path so you can save your configuration; I learned this the hard way when I had to restart my container and I had to essentially start from scratch. Set up is pretty trivial, so I didn’t lose too much time, but it’s still annoying to lose my work.
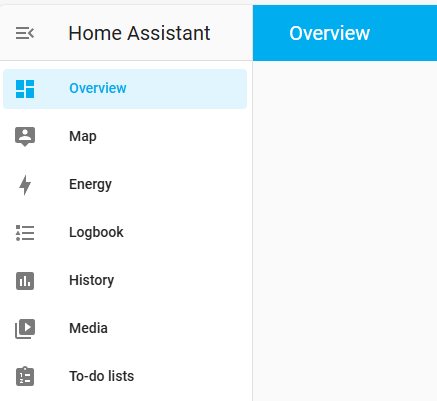
Once that was up and running, I visited the URL for the host it is on such as http://localhost:8123, and I was greeted with the dashboard after configuring my first user:

Adding Devices
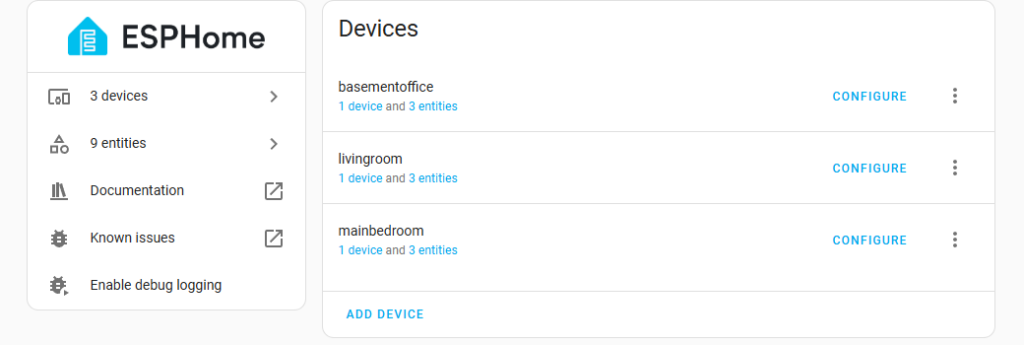
Because Home Assistant supports ESPHome, it automatically detected the devices on my network and prompted me to add them. After naming them and assigning them to an area, I had all of my sensors in Home Assistant in no time:

That also meant that I could see the data being collected in Home Assistant, which has its own graphs and dashboards ready to go:

This was great, but I still needed one more step to achieve my goal: to actually get the data into Elastic. Fortunately, as previously mentioned, Home Assistant has a well-documented API, so all I needed to do was create an API token and start making API calls.
Sending to Elastic
The Home Assistant API returns JSON data, so my plan was to grab the data and just dump to a Logstash JSON listener. It was pretty much a copy/paste of the listener I use for CoreTemp data, just on a different port. With the listener set up, I created a very simple Python script to pull the data and send it to Logstash and hence to Elastic. Note: there is a HomeAssistant wrapper for Python that I could have used, but the API is so simple I went with the easy requests route instead. In my file, I have a function to grab the data for a given entity:
def get_data(entity_id, token, logger):
    base_url = "http://localhost:8123/"
    headers = {
            "Authorization": f'Bearer {token}',
            "content-type": "application/json"
            }

    url = base_url + f"api/states/{entity_id}"
    try:
        response = get(url,headers=headers)
        data = response.text
        return data
    except requests.exceptions.HTTPError as err:
        logger.error(f"HTTP error occurred: {err}")
    except Exception as e:
        logger.error(f"An error occurred: {e}")
This uses the API token created in Home Assistant to get the latest state for an entity and return the data. In the main function, I iterate through a list of entities provided on the command line, and if I get data, I create a socket to send to the Logstash listener:
 for entity in args.entities:
        logger.info(f'Getting data for entity {entity}')
        data = get_data(entity,args.token, logger)

        jsondata = json.loads(data)
        # Check to see if entity exists
        if jsondata.get("message") == "Entity not found.":
            continue
        # Check to see if data is avaiable
        if jsondata.get("state") == "unavailable":
            continue
        s = socket.socket(socket.AF_INET,socket.SOCK_STREAM)
        s.connect(('192.168.X.XXX',5201))
        s.sendall(bytes(data,encoding='utf-8'))
        s.close()
This will ignore entities that don’t exists or are offline, which helps keep bad data out of Elastic. To run, I set up a cron job to pull this data every 5 minutes.
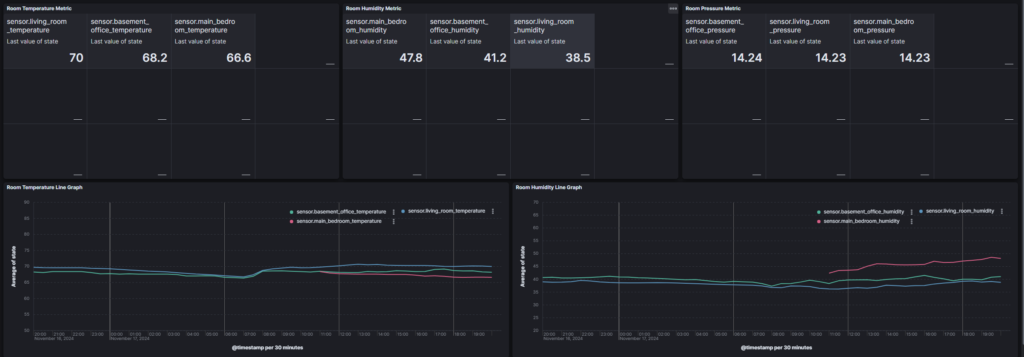
On the Elastic side of things, I set up a separate data stream and index template for this data: you’ll want to ensure that the state field is a float so you can do math on the values it returns. After configuring everything properly and setting up some Kibana metrics and visualizations, I had all of that data in Elastic!

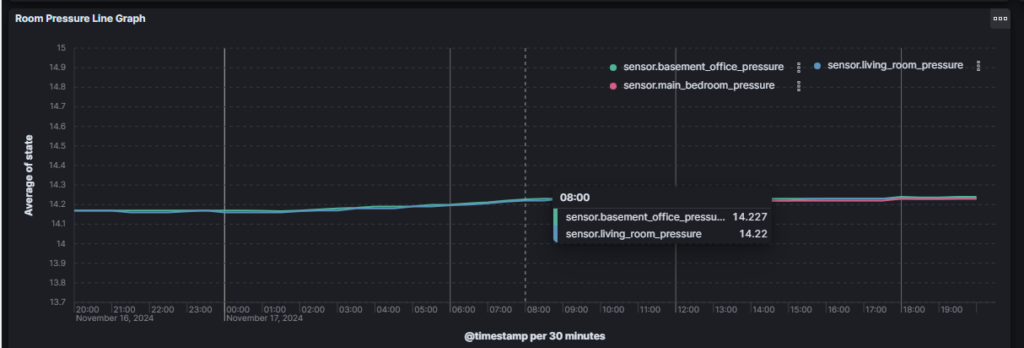
I have to say that surprisingly the coolest part is to see the barometric pressure graph, as it can tell you very quickly when storms are coming due to falling pressure, or nice weather when the pressure is on the upswing:

I may clean up the Python script a bit and put it online, and if I do I’ll let people know. Happy data collecting and automating!
