Yesterday, I told the tale of getting netflow data out of my EdgeOS router. Once I started actually receiving data, I wanted to get it into Splunk. I figured that I would have to set up a directory for netflow log data from nfdump, then set up a reader to have Splunk ingest the data. After doing some Googling, though, I found the Splunk Add-on for NetFlow, which handles all of that automatically! Once you get it up and running, that is.
Downloading and installing the add-on was simple. Next came configuration, and learned lesson one: run the configuration script as the user Splunk runs under and not another user: doing so will screw up permissions on the files the script creates. Lesson number two: every time you run the configuration script you need to manually kill nfcapd first, otherwise the script will fail.
Those two items done, I was only getting very intermittent data into Splunk, and the destination directory where the nfdump files were supposed to end up was always empty. It was at this point I looked at the script that was running to do the data export, and found an error caused by the configuration script: if you don’t manually enter the number of days to keep the log files around, the script will put in a negative number, deleting the log files immediately after creation. This created your classic race condition, and usually the files were deleted before Splunk could read them, but sometimes Splunk would read a few lines first.
Finally, after getting everything working as it should, I set up some dashboards. This was a simple timechart showing egress traffic over time (egress was engine-id 2 as you may remember):
index=netflow engine=”0/2″ | timechart sum(bytes) | fillnull
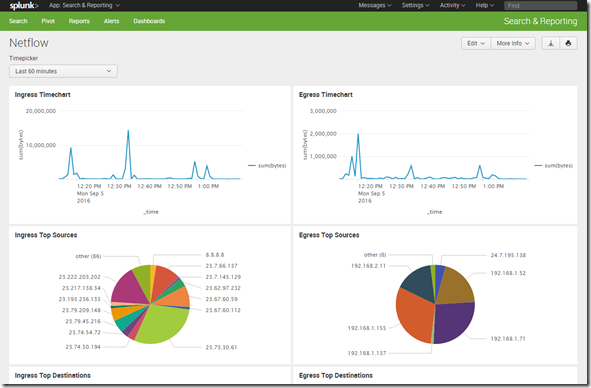
I also set up some pivots to create some pie charts. In the end, my very simple dashboard looked like this:
Future improvements could include combining ingress and egress traffic into one chart, and replacing IP addresses with hostnames for internal IPs.
It took longer than I thought, but in the end it worked out pretty well.

