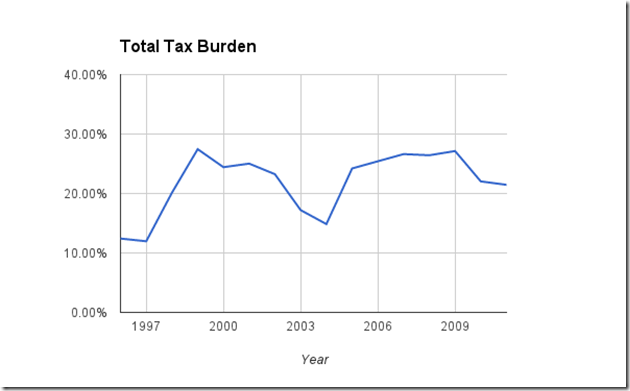
Note: These graphs have been corrected in the 2012 Tax Incidence post.
I like analysis, and I like tax policy. Put the two together, as I’ve done before, and it’s a pretty sweet time. But I have a lot of numbers at my disposal, much more than the past couple of years. So because I had little better to do, I decided to calculate my tax incidence for the time I’ve been working, which is a very long time indeed. All the details after the jump.
I’ve been tracking my income and expenses in Quicken forever (despite it being terrible software), so I could pretty easily figure out my tax burdens. Income taxes and payroll taxes were easy. Property taxes were difficult due to renting: I used an estimate of 15% of rent towards property taxes, less than the 17% calculated on the Minnesota Property Tax Refund. Sales taxes were also somewhat dicey, as I had to estimate based on various categories of spending. Ditto for the liquor tax, which I included simply because it was easy to do so. Gas tax was also easy: in addition to monitoring my spending, I’ve been monitoring my gas consumption forever too.
The end result is a pretty interesting, and volatile, total tax burden:
Which breaks down like this:
Clearly, federal income taxes are the most volatile. Some years I pay more in payroll taxes than income taxes, others the reverse. Here’s a cumulative shot:
Another thing I did was break it down by state taxes only:
This pretty closely matches the MN Tax Incidence Study. My rates are a couple percentage points below the study, since I didn’t include indirect taxes like the individual portion of the corporate income tax, and so forth. There’s simple no way I would have been able to calculate that.
I’m not sure what all of this means, but I find it interesting.


