Well, three actually, but two concepts: Price of Government and Tax Incidence. They are pretty important in understanding Minnesota’s budget and tax issues.
Fortunately for all of us, the state of Minnesota is pretty good when it comes to collecting statistics on taxes and spending. One of the key measurements is what is known as the Price of Government. Simply put, this is the total of all state and local taxes (income taxes, sales taxes, property taxes, excise taxes, fees, the works), divided by the total statewide personal income. In short, it shows what percentage of Minnesota income is sent to all state and local levels of government in the form of taxes.
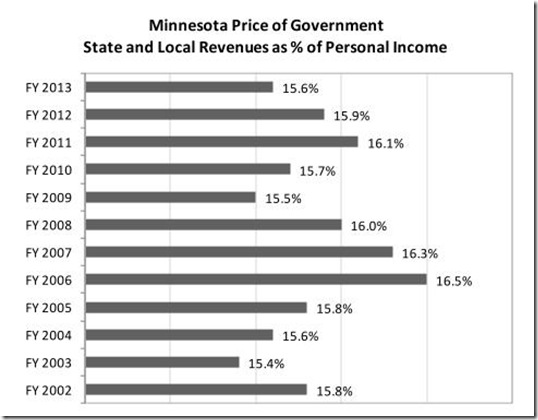
The Price of Government helps us understand whether taxes are “high” or “low” relative to previous periods in the state’s history, and what the trends are. This information is generated in the state economic forecasts. Here are the numbers for the November 2008 economic forecast, the most recent available with Price of Government Information:
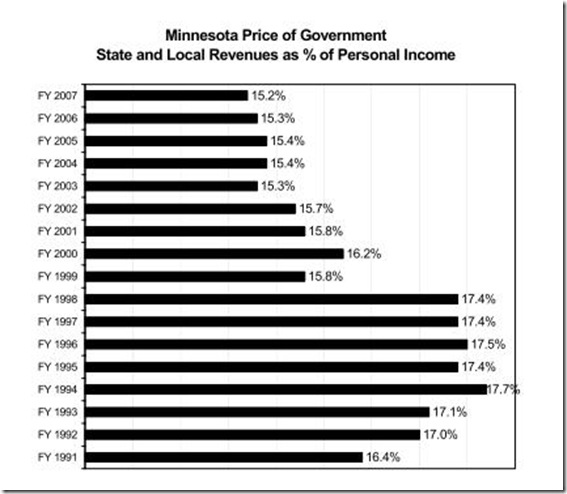
From that graph, it looks like things bounce around a bit at random, mainly between 15.5% and 16.5% of state personal income. In general, though, on this graph it looks like if we were to raise taxes, it would push us above where taxes have been in the past, above that 16.5% threshold, the maximum on this graph. But is that the maximum? As a matter of fact, it isn’t. Let’s now look at the November 2002 economic forecast, which shows data going back even further:
Now this is interesting. Prior to 1999, and for much of the 1990s, the price of government was significantly higher, above 17% for every year between 1992 and 1998. It was only after the huge budget surpluses and consequent tax cuts in 1999 that the price of government fell substantially.
This demonstrates that taxes in Minnesota as a percentage of personal income are up to two full percentage points from their peak in the 1990s: it can hardly be said that the tax burden now is more onerous than it has been in the past. Even the recent peak of 16.5% in Fiscal Year 2006 is more than a full percentage point below the 17.7% peak in Fiscal Year 1994. Moreover, the 1990s were not exactly a period of low economic growth. In fact, as everybody remembers, it was a period of sustained growth. This puts quite a few holes in the “higher taxes would destroy economic growth” theory that many conservatives espouse.
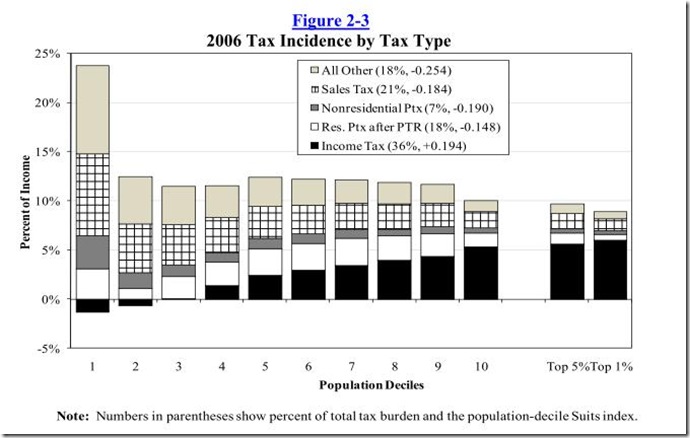
So much for the aggregate tax total, now on to who is paying those taxes. For this, we can look to something called Tax Incidence. This shows us how much people pay in taxes based on their income. Every two years the state does such a study, and here are the results for the most recent, the 2009 Tax Incidence Study:
The first decile, the 10% of people who make the least amount of money, include many people such as teens and college students who work part-time; this is why the first decile is so clearly out of step with the others in terms of tax incidence. The rest of the deciles, though, show a pretty clear pattern. The group paying the highest percentage of income in taxes is the fifth decile, right smack in the middle (this group is made up of people making approximately $35,000 to $45,000 per year). As you make more money, the percentage of your income that you pay in taxes decreases, until you reach the top 1% of income earners, who are paying taxes at a lower rate than all other deciles.
Let’s state that again: If you make over $480,000 a year, you pay a lower tax rate than somebody making $20,000 a year when you consider all state and local taxes. The income tax is not progressive enough on the high end to make up for the regressivity of sales and property taxes on the low end.
This information may be somewhat technical in nature, and thus not reported in the media very often, but it is pretty important context for evaluating claims about taxation, especially taxation on the wealthiest people in the state. I think it would be helpful if all evaluations of tax proposals included this information so people could form educated opinions of them.


